Tag Archives: node.js

Running Puppeteer under Docker

Puppeteer is an API enabling browser automation via Chrome/Chromium. Quoting its homepage:

“Puppeteer is a Node.js library which provides a high-level API to control Chrome/Chromium over the DevTools Protocol. Puppeteer runs in headless mode by default, but can be configured to run in full (non-headless) Chrome/Chromium.”

I’ve already shown it in action a couple of years ago in my article, “Gathering Net Salary Data with Puppeteer“, where I used it for web scraping. Browser automation is also very common for automated testing of web applications, and may also be used for a lot of other things.

As with any other piece of software, it is sometimes convenient to package a Puppeteer script in a Docker container. However, since deploying a browser is fundamentally more complicated than your average API, Puppeteer and Docker are a little tricky to get working together. In this article, we’ll see why this combination is problematic and how to solve it.

A Minimal Puppeteer Example

Before we embark upon our Docker journey, we need a simple Puppeteer program we can test with. The easiest thing we can do is use Puppeteer to open a webpage and take a screenshot of it. We can do this quite easily as follows.

First, we need to create a folder, install prerequisites, and create a file in which to put our JavaScript code. The following bash script takes care of all this, assuming you already have Node.js installed. Please note that I am working on Linux Kubuntu 22.04, so if you’re using a radically different operating system, the steps may vary a little.

mkdir pupdock
cd pupdock
npm install puppeteer
touch main.js

Next, open main.js with your favourite text editor or IDE and use the following code (adapted from “Gathering Net Salary Data with Puppeteer“):

const puppeteer = require('puppeteer');
 
(async () => {
  const browser = await puppeteer.launch();
  const page = await browser.newPage();
  await page.goto('https://www.programmersranch.com');
  await page.screenshot({ path: 'screenshot.png' });
  await browser.close();
})();

To see that it works, run this script using the following command:

node main.js

A file called screenshot.png should be saved in the same folder:

A screenshot of my older tech blog, Programmer’s Ranch, complete with Blogger’s stupid cookie banner.

An Initial Attempt with Docker

Now that we know that the script works, let’s try and make a Docker image out of it. Add a Dockerfile with the following contents:

FROM node:19-alpine3.16
WORKDIR /puppeteer
COPY main.js package.json package-lock.json ./
RUN npm install
CMD ["node", "main.js"]

What we’re doing here is starting from a recent (at the time of writing this article) Node Docker image. Then we set the current working directory to a folder called /puppeteer. We copy the script along with the list of package dependencies (Puppeteer, basically) into the image, install those dependencies, and set up the image to execute node main.js when it is run.

We can build the Docker image using the following command, giving it the tag of “pupdock” so that we can easily find it later. The sudo command is only necessary if you’re running on Linux.

sudo docker build -t pupdock .

Once the image is built, we can run a container based on this image using the following command:

sudo docker run pupdock

Unfortunately, we hit a brick wall right away:

/puppeteer/node_modules/puppeteer-core/lib/cjs/puppeteer/node/BrowserRunner.js:300
            reject(new Error([
                   ^

Error: Failed to launch the browser process! spawn /root/.cache/puppeteer/chrome/linux-1108766/chrome-linux/chrome ENOENT


TROUBLESHOOTING: https://pptr.dev/troubleshooting

    at onClose (/puppeteer/node_modules/puppeteer-core/lib/cjs/puppeteer/node/BrowserRunner.js:300:20)
    at ChildProcess.<anonymous> (/puppeteer/node_modules/puppeteer-core/lib/cjs/puppeteer/node/BrowserRunner.js:294:24)
    at ChildProcess.emit (node:events:512:28)
    at ChildProcess._handle.onexit (node:internal/child_process:291:12)
    at onErrorNT (node:internal/child_process:483:16)
    at process.processTicksAndRejections (node:internal/process/task_queues:82:21)

Node.js v19.8.1

The error and stack trace are both pretty cryptic, and it’s not clear why this failed. There isn’t much you can do other than beg Stack Overflow for help.

Fortunately, I’ve done this already myself, and I can tell you that it fails because Chrome (which Puppeteer is trying to launch) needs more security permissions than Docker provides by default. We’ll need to learn a bit more about Docker security to make this work.

Dealing with Security Restrictions

So how do we give Chrome the permissions it needs, without compromising the security of the system it is running on? We have a few options we could try.

  • Disable the sandbox. Chrome uses a sandbox to isolate potentially harmful web content and prevent it from gaining access to the underlying operating system (see Sandbox and Linux Sandboxing docs to learn more). Many Stack Overflow answers suggest getting around errors by disabling this entirely. Unless you know what you’re doing, this is probably a terrible idea. It’s far better to relax security a little to allow exactly the permissions you need than to disable it entirely.
  • Use the Puppeteer Docker image. Puppeteer’s documentation on Docker explains how to use a Puppeteer’s own Docker images (available on the GitHub Container Registry) to run arbitrary Puppeteer scripts. While there’s not much info on how to work with these (e.g. which folder to mount as a volume in order to grab the generated screenshot), what stands out is that this approach requires the SYS_ADMIN capability, which exposes more permissions than we need.
  • Build your own Docker image. Puppeteer’s Troubleshooting documentation (also available under Chrome Developers docs and Puppeteer docs) has a section on running Puppeteer in Docker. We’ll follow this method, as it is the one that worked best for me.

A Second Attempt Based on the Docs

Our initial attempt with a simple Dockerfile didn’t go very well, but now we have a number of other Dockerfiles we could start with, including the Puppeteer Docker image’s Dockerfile, a couple in the aforementioned doc section on running Puppeteer in Docker (one built on a Debian-based Node image, and another based on an Alpine image), and several other random ones scattered across Stack Overflow answers.

My preference is the Alpine one, not only because Alpine images tend to be smaller than their Debian counterparts, but also because I had more luck getting it to work across Linux, Windows Subsystem for Linux and an M1 Mac than I did with the Debian one. So let’s replace our Dockerfile with the one in the Running on Alpine section, with a few additions at the end:

FROM alpine

# Installs latest Chromium (100) package.
RUN apk add --no-cache \
      chromium \
      nss \
      freetype \
      harfbuzz \
      ca-certificates \
      ttf-freefont \
      nodejs \
      yarn

# Tell Puppeteer to skip installing Chrome. We'll be using the installed package.
ENV PUPPETEER_EXECUTABLE_PATH=/usr/bin/chromium-browser

# Puppeteer v13.5.0 works with Chromium 100.
RUN yarn add puppeteer@13.5.0

# Add user so we don't need --no-sandbox.
RUN addgroup -S pptruser && adduser -S -G pptruser pptruser \
    && mkdir -p /home/pptruser/Downloads /app \
    && chown -R pptruser:pptruser /home/pptruser \
    && chown -R pptruser:pptruser /app

# Run everything after as non-privileged user.
USER pptruser

WORKDIR /puppeteer
COPY main.js ./
CMD ["node", "main.js"]

Because the given Dockerfile already installs the puppeteer dependency and that’s all we need here, I didn’t even bother to do the usual npm install here, although a more complex script might possibly have additional dependencies to install.

At this point, we can build the Dockerfile and run the resulting image as before:

sudo docker build -t pupdock .
sudo docker run pupdock

The result is that it still doesn’t work, but the error is something that is more easily Googled than the one we have before:

/node_modules/puppeteer/lib/cjs/puppeteer/node/BrowserRunner.js:237
            reject(new Error([
                   ^

Error: Failed to launch the browser process!
Failed to move to new namespace: PID namespaces supported, Network namespace supported, but failed: errno = Operation not permitted


TROUBLESHOOTING: https://github.com/puppeteer/puppeteer/blob/main/docs/troubleshooting.md

    at onClose (/node_modules/puppeteer/lib/cjs/puppeteer/node/BrowserRunner.js:237:20)
    at ChildProcess.<anonymous> (/node_modules/puppeteer/lib/cjs/puppeteer/node/BrowserRunner.js:228:79)
    at ChildProcess.emit (node:events:525:35)
    at ChildProcess._handle.onexit (node:internal/child_process:291:12)

Node.js v18.14.2

A Little Security Lesson

Googling that error about PID namespaces is what led me to the solution, but it still took a while, because I had to piece together many clues scattered in several places, including:

  • Answer by usethe4ce suggests downloading some chrome.json file and passing it to Docker, but it’s not immediately clear what this is/does.
  • Answer by Riccardo Manzan, based on the one by usethe4ce, provides an example Dockerfile based on Node (not Alpine) and also shows how to pass the chrome.json file both in docker run and docker-compose.
  • GitHub Issue by WhisperingChaos explains what that chrome.json is about.
  • Answer by hidev lists the five system calls that Chrome needs.

To understand all this confusion, we first need to take a step back and understand something about Docker security. Like the Chrome sandbox, Docker has its ways of restricting the extent to which a running Docker container can interact with the host.

Like any Linux process, a container requests whatever it needs from the operating system kernel using system calls. However, a container could be used to wreak havoc on the host if it is allowed to run whatever system calls it wants and then is successfully breached by an attacker. Fortunately, Linux provides a feature called seccomp that can restrict system calls to only the ones that are required, minimising the attack surface.

In Docker, this restriction is applied by means of a seccomp profile, basically a JSON file whitelisting the system calls to be allowed. Docker’s default seccomp profile restricts access to system calls enough that it prevents many known exploits, but this also prevents more complex applications that need additional system calls – such as Chrome – from working under Docker.

That chrome.json I mentioned earlier is a custom seccomp profile painstakingly created by one Jess Frazelle, intended to allow the system calls that Chrome needs but no more than necessary. This should be more secure than disabling the sandbox or running Chrome with the SYS_ADMIN capability.

A Third Attempt with chrome.json

Let’s give it a try. Download chrome.json and place it in the same folder as main.js, the Dockerfile and everything else. Then, run the container as follows:

sudo docker run --security-opt seccomp=path/to/chrome.json pupdock

This time, there’s no output at all – which is good, because it means the errors are gone. To ensure that it really worked, we’ll grab the screenshot from inside the stopped container. First, get the container ID by running:

sudo docker container ls -a

Then, copy the screenshot from the container to the current working directory as follows, taking care to replace 7af0d705a751 with the actual ID of the container:

sudo docker cp 7af0d705a751:/puppeteer/screenshot.png ./screenshot.png
Puppeteer worked: the screenshot contains the full length of the page.

Additional Notes

I omitted a few things to avoid breaking the flow of this article, so I’ll mention them here briefly:

  • That SYS_ADMIN capability we saw mentioned earlier belongs to another Linux security feature: capabilities, which are also related to seccomp profiles.
  • If you need to pass a custom seccomp profile in a docker-compose.yaml file, see Riccardo Manzan’s Stack Overflow answer for an example.
  • If you run into other issues, use the dumpio setting to get more verbose output. It’s a little hard to separate the real errors from the noise, but it does help. Be sure to run in headless mode (it doesn’t make sense to run the GUI browser under Docker), and disable the GPU (--disable-gpu) if you see related errors.

Conclusion

Running Puppeteer under Docker might sound like an unusual requirement, perhaps overkill, but it does open up a window onto the interesting world of Docker security. Chrome’s complexity requires that it be granted more permissions than the typical Docker container.

It is unfortunate that the intricacies around getting Puppeteer to work under Docker are so poorly documented. However, once we learn a little about Docker security – and the Linux security features that it builds on – the solution of using a custom seccomp profile begins to make sense.

Working with VS Code Launch Configurations

Visual Studio Code (VS Code) is a wonderful IDE. I’m not generally known to praise Microsoft’s products, but VS Code lets me develop and debug code productively in all the languages I’ve needed to work with, on any operating system. I don’t even use Visual Studio any more.

Launch configurations are at the heart of debugging with VS Code. In this article, I’ll explain how you can debug code using different languages, even at the same time. I’ll also show you how you can customise these launch configurations to pass command-line arguments, set environment variables, run pre-launch tasks, and more.

Getting Started with Launch Configurations

Anytime you want to debug something, you just press F5 (like in Visual Studio). Initially, you probably won’t have any launch configurations set up, in which case you’ll be prompted to choose what kind of launch configuration you want to create, as shown in the screenshot below. This list might vary depending on the language runtimes you have installed. When you select one, you’ll be guided towards creating a sample launch configuration.

Pressing F5 brings up a list of languages for which you can create launch configurations.

Another way is to click on the Debug tab on the left, which looks like a play button. You can then click the link to “create a launch.json” file, shown in the screenshot below. We’ll see this in practice in the next sections as we create launch configurations for various languages.

The Debug tab allows you to “create a launch.json file”.

Debugging Python

Before we debug anything, we need some code. Let’s add a folder with a Python file in it, and add the following code:

import time
import datetime

while True:
    time.sleep(1)
    print(f"Swiss church bells say it's {datetime.datetime.now()}")

If I press F5, this actually works for me out of the box:

Pressing F5 runs the Python program and lets us debug it.

Clicking next to a line number adds a breakpoint. When the program hits that point, it pauses and allows us to inspect variables and other things. You can press F10 to go to the next statement, F11 to step into a function call, and Shift+F11 to step out. While a tutorial on how to debug code is outside the scope of this article, if you’re unfamiliar with debugging, this should at least be enough to get you started.

After hitting a breakpoint in the Python program, we can advance step by step and see the state of local variables.

A Launch Configuration for Python

Follow either of the methods in the earlier “Getting Started” section to create your first Python launch configuration. This creates a launch.json file under a .vscode folder with the following contents. As launch.json may contain personally customised configurations for different developers (e.g. with different input parameters), it’s best not to commit it to source control.

{
    // Use IntelliSense to learn about possible attributes.
    // Hover to view descriptions of existing attributes.
    // For more information, visit: https://go.microsoft.com/fwlink/?linkid=830387
    "version": "0.2.0",
    "configurations": [
        {
            "name": "Python: Current File",
            "type": "python",
            "request": "launch",
            "program": "${file}",
            "console": "integratedTerminal",
            "justMyCode": true
        }
    ]
}

There isn’t much to it: this will simply run whatever file you have open in VS Code (which is what ${file} means). This is useful if you want to run specific files (I do this with tests in Go for instance), but not so much if you have a program with a single entry point and want to run that regardless of what you have open in VS Code. In that case, it’s easy to change the program value:

{
    "version": "0.2.0",
    "configurations": [
        {
            "name": "Python: Main File",
            "type": "python",
            "request": "launch",
            "program": "${workspaceFolder}/pyticker/main.py",
            "console": "integratedTerminal",
            "justMyCode": true
        }
    ]
}

${workspaceFolder} represents the folder we have open in VS Code, so this makes sure we’re relative to that. ${workspaceFolder}, ${file} and other such variables are documented in VS Code’s Variables Reference.

Command Line Arguments

Let’s modify our Python program as follows:

import time
import datetime
import sys

while True:
    time.sleep(int(sys.argv[2]))
    print(f"{sys.argv[1]} church bells say it's {datetime.datetime.now()}")

The program now takes the nationality of the church bells as well as the sleep interval from command-line arguments. We’re not doing validation or error-handling for the sake of brevity. The following is an example of how to execute this successfully from a terminal:

$ python3 main.py Maltese 5
Maltese church bells say it's 2023-02-15 19:04:28.311805
Maltese church bells say it's 2023-02-15 19:04:33.315787
Maltese church bells say it's 2023-02-15 19:04:38.319811

To pass the same command-line arguments when debugging with VS Code, we add args to the launch configuration:

{
    "version": "0.2.0",
    "configurations": [
        {
            "name": "Python: Main File",
            "type": "python",
            "request": "launch",
            "program": "${workspaceFolder}/pyticker/main.py",
            "console": "integratedTerminal",
            "justMyCode": true,
            "args": ["Maltese", "5"]
        }
    ]
}

Multiple Launch Configurations

As you no doubt noticed, launch.json contains a JSON array of configurations. That means it’s very easy to add more of these configurations, for instance, when you need to provide different inputs:

{
    "version": "0.2.0",
    "configurations": [
        {
            "name": "Python Ticker (Maltese)",
            "type": "python",
            "request": "launch",
            "program": "${workspaceFolder}/pyticker/main.py",
            "console": "integratedTerminal",
            "justMyCode": true,
            "args": ["Maltese", "5"]
        },
        {
            "name": "Python Ticker (Swiss)",
            "type": "python",
            "request": "launch",
            "program": "${workspaceFolder}/pyticker/main.py",
            "console": "integratedTerminal",
            "justMyCode": true,
            "args": ["Swiss", "1"]
        }
    ]
}

From the Debug tab, you can then select the configuration you want to run from the drop-down before hitting F5 to debug with that configuration:

The drop-down in the Debug tab lets you select which Launch Configuration you want to debug.

A Launch Configuration for Node.js

Let’s add a new folder as a sibling to our Python folder, and add the following code in a new app.js file, completely disregarding cleanup for the sake of brevity and YOLO:

const fs = require('fs');

setInterval(() => {
    message = `Swiss church bells say it's ${new Date()}`;
    console.log(message)
    fs.appendFileSync('ding-dong.txt', message + '\n');
}, 1000);

We can set up a simple launch configuration to run this in launch.json:

...
    "configurations": [
        {
            "name": "Node.js Ticker",
            "program": "${workspaceFolder}/jsticker/app.js",
            "request": "launch",
            "type": "node"
        },
...

It works, writing output every second both to standard output and a file:

The Node.js program’s output can be seen in the Debug Console as well as the output file. The overall folder structure is also shown on the left.

The only problem is that the file was created top-level, and since we only specified a filename in the code (not a folder or path), then this must mean that Node.js is running with the top-level folder in VS Code as the current working directory. We can change that in the launch configuration using cwd:

...
    "configurations": [
        {
            "name": "Node.js Ticker",
            "program": "${workspaceFolder}/jsticker/app.js",
            "request": "launch",
            "cwd": "${workspaceFolder}/jsticker",
            "type": "node"
        },
...

When we run this again, the file is created under the jsticker folder.

Pre-Launch Tasks

Sometimes you want to run something before starting your program. For instance, in my work setup, I generate Swagger docs and perform other prerequisite tasks. But since we’re not doing anything that fancy, we’ll just delete the ding-dong.txt file every time we run the “Node.js Ticker” launch configuration.

To do this, we first need to add a tasks.json file inside the .vscode folder, next to launch.json, and add the following to it:

{
    "version": "2.0.0",
    "tasks": [
      {
        "label": "rmfile",
        "command": "rm",
        "args": ["ding-dong.txt"],
        "options":{
            "cwd": "${workspaceFolder}/jsticker"
        }
      }
    ]
  }

This defines a task called rmfile that will run rm ding-dong.txt from the jsticker folder. We then refer to this task in the relevant launch configuration using preLaunchTask:

...
        {
            "name": "Node.js Ticker",
            "program": "${workspaceFolder}/jsticker/app.js",
            "request": "launch",
            "cwd": "${workspaceFolder}/jsticker",
            "preLaunchTask": "rmfile",
            "type": "node"
        },
...

A Launch Configuration for Go (GoLang)

For Go, we need to:

  1. Run go work init from the top-level folder opened in VS Code
  2. Create a new folder alongside pyticker and jsticker
  3. Run go mod init main in it
  4. Add the following code to a new main.go file:
package main

import (
	"fmt"
	"time"
)

func main() {
	for {
		now := time.Now()
		fmt.Printf("Swiss bells won't stop ringing! It's %s!\n", now)
		time.Sleep(time.Second)
	}
}

We can now add a launch configuration for this Go program:

...
        {
            "name": "Go Ticker",
            "type": "go",
            "request": "launch",
            "mode": "debug",
            "program": "${workspaceFolder}/goticker/main.go"
        },
...

And we can have lots of fun running and debugging it, as a reminder that Swiss church bells need to tell you the time all the time. It’s not like they sell watches in Switzerland or anything.

Our Go program runs via the “Go Ticker” launch configuration.

Environment Variables

As we’ve seen with the Python example, however, other countries also have church bells. Instead of using command-line arguments to customise the output, we’ll instead pass environment variables. First, we need to modify the code a little:

package main

import (
	"fmt"
	"os"
	"strconv"
	"time"
)

func main() {
	for {
		country := os.Getenv("COUNTRY")
		intervalSecsStr := os.Getenv("INTERVAL_SECS")
		intervalSecs, _ := strconv.Atoi(intervalSecsStr)
		now := time.Now()
		fmt.Printf("%s bells won't stop ringing! It's %s!\n", country, now)
		time.Sleep(time.Duration(intervalSecs) * time.Second)
	}
}

Then we add the relevant environment variables as key-value pairs in an env block in the launch configuration:

...
        {
            "name": "Go Ticker",
            "type": "go",
            "request": "launch",
            "mode": "debug",
            "program": "${workspaceFolder}/goticker/main.go",
            "env": {
                "COUNTRY": "Maltese",
                "INTERVAL_SECS": "3"
            }
        },
...

When you run it again, it makes all the difference:

The Go program runs with environment variables set.

Go Build Flags

Go has some specific build flags that can’t be passed as regular command-line parameters, such as build tags or the Data Race Detector. If you want to use these, you’ll have to pass them via buildFlags instead:

...
            "buildFlags": "-race",
...

Running Multiple Programs with Compounds

It’s common to need to run multiple programs at once, especially in a microservices architecture, or if there are separate backend and frontend applications. This can be done in VS Code using compound launch configurations. For instance, if we wanted to run both the Python and Go programs, we could define a compound as follows (compounds go after configurations in launch.json):

{
    "version": "0.2.0",
    "configurations": [
        {
            "name": "Go Ticker",
            "type": "go",
            "request": "launch",
            "mode": "debug",
            "program": "${workspaceFolder}/goticker/main.go",
            "env": {
                "COUNTRY": "Maltese",
                "INTERVAL_SECS": "3"
            }
        },
        {
            "name": "Node.js Ticker",
            "program": "${workspaceFolder}/jsticker/app.js",
            "request": "launch",
            "cwd": "${workspaceFolder}/jsticker",
            "preLaunchTask": "rmfile",
            "type": "node"
        },
        {
            "name": "Python Ticker (Maltese)",
            "type": "python",
            "request": "launch",
            "program": "${workspaceFolder}/pyticker/main.py",
            "console": "integratedTerminal",
            "justMyCode": true,
            "args": ["Maltese", "5"]
        },
        {
            "name": "Python Ticker (Swiss)",
            "type": "python",
            "request": "launch",
            "program": "${workspaceFolder}/pyticker/main.py",
            "console": "integratedTerminal",
            "justMyCode": true,
            "args": ["Swiss", "1"]
        }
    ],
    "compounds": [
        {
            "name": "Go and Python Tickers",
            "configurations": ["Go Ticker", "Python Ticker (Swiss)"]
        }
    ]
}

The compound simply refers to the individual launch configurations by name, and has a name of its own. It can then be selected from the drop-down in the Debug tab just like any other launch configuration. By running a compound, you can debug and hit breakpoints in any application that is part of that compound.

In fact, you’ll notice there is a new drop-down next to the debugging buttons towards the central-top part of the screen. This allows you to switch certain views (e.g. the Debug Console) between running applications.

A compound can be selected from the list of launch configurations in the Debug tab. When it is run, a dropdown appears next to the debugging buttons in the top part of the screen.

Conclusion

We’ve seen that Launch Configurations allow you to run and debug applications in VS Code with great flexibility, including:

  • Run the current file or a specific one
  • Set the current working directory
  • Run different programs
  • Use different programming languages
  • Set up different configurations even for the same program
  • Pass command-line arguments
  • Set environment variables
  • Run/debug multiple programs at the same time

This provides a great IDE experience even for more complex application architectures in a monorepo.

Gathering Net Salary Data with Puppeteer

Tax is one of those things that makes moving to a different country difficult, because it varies wildly between countries. How much do you need to earn in that country to maintain the same standard of living?

You can, of course, use an online salary calculator to understand how much net salary you’re left with after deducting tax and social security contributions, but this only lets you sample specific salaries and doesn’t really give you enough information to assess how the impact of tax changes as you earn more. Importantly, you can’t use these tools to draw a graph for each country and compare.

Malta Salary Calculator by Darren Scerri

Fortunately, however, these tools have already done the heavy lifting by taking care of the complex calculations. To build a graph, all we really need to do is to take samples at regular intervals, say, every 1,000 Euros. Since that is very tedious to do by hand, we’ll use a browser automation tool to do this for us.

Enter Puppeteer

Puppeteer, as the homepage says, “is a Node library which provides a high-level API to control Chrome or Chromium”, which is pretty much what we need for this job. It also gives us what we need to get started. In a new folder, run the following to install the puppeteer dependency:

npm i puppeteer

Then, create a new file (e.g. netsalary.js) and add the starter code from the Puppeteer homepage. We’ll use this as a starting point:

const puppeteer = require('puppeteer');

(async () => {
  const browser = await puppeteer.launch();
  const page = await browser.newPage();
  await page.goto('https://example.com');
  await page.screenshot({ path: 'example.png' });

  await browser.close();
})();

Getting Salary Data for Malta

In this particular exercise, we’ll get the salary data for Malta using Darren Scerri’s Malta Salary Calculator, which is relatively easy to work with.

Before we write any code, we need to understand the dynamics of the calculator. We do this via the browser’s developer tools.

Whenever you change the value of the gross salary input field (that has the “salary” id in the HTML), a bunch of numbers get updated, including the yearly net salary (which has the “net-yearly-result” class) which is what we’re interested in.

Just by knowing how we can reach the relevant elements, we can write our first code to retrieve the input (gross salary) and output (yearly net salary) values to make sure we know what we’re doing:

const puppeteer = require('puppeteer');

(async () => {
  const browser = await puppeteer.launch();
  const page = await browser.newPage();
  await page.goto('http://maltasalary.com/');
  
  // Gross salary
  const grossSalaryInput = await page.$("#salary");
  const grossSalary = await page.evaluate(element => element.value, grossSalaryInput);
  console.log('Gross salary: ', grossSalary);
  
  // Net salary
  const netSalaryElement = await page.$('.net-yearly-result');
  const netSalary = await page.evaluate(element => element.textContent, netSalaryElement);
  console.log('Net salary: ', netSalary);

  await browser.close();
})(); 

Here, we’re using the page.$() function to locate an element the same way we would using jQuery. Then we use the page.evaluate() function to get something from that element (in this case, the value of the input field). We do the same for the net salary, with the notable difference that in the page.evaluate() function, we get the textContent property of the element instead.

If we run this (node netsalary.js), we should get the same default values we see in the online salary calculator:

We managed to retrieve the gross and net salaries from the online calculator.

Text Entry

That was easy enough, but it used the default values that are present when the page is loaded. How do we manipulate the input field so that we can enter arbitrary gross salary values and later pick up the computed net salary?

The simplest way to do this is by simulating keyboard input as follows:

const puppeteer = require('puppeteer');

(async () => {
  const browser = await puppeteer.launch();
  const page = await browser.newPage();
  await page.goto('http://maltasalary.com/');
  
  const grossSalary = 30000;
  
  // Gross salary - keyboard input
  await page.focus("#salary");
  
  for (var i = 0; i < 6; i++)
    await page.keyboard.press('Backspace');
  
  await page.keyboard.type(grossSalary.toString());
  
  // Net salary
  const netSalaryElement = await page.$('.net-yearly-result');
  const netSalary = await page.evaluate(element => element.textContent, netSalaryElement);
  console.log('Net salary: ', netSalary);

  await browser.close();
})(); 

Here, we:

  1. Focus the input field, so that whatever we type goes in there.
  2. Press backspace six times to erase any existing gross salary in the field (if you check the online calculator, you’ll see it can take up to six digits).
  3. Type in the string version of our gross salary, which is a hardcoded constant with a value of 30,000.

The result I get when I run this matches what the online calculator gives me. I guess I must be doing something right for once in my life.

Net salary:  22,805.44

Pulling Net Salary Data in a Range

So now we know how to enter a gross salary and read out the corresponding net salary. How do we do this at regular intervals within a range (e.g. every 1,000 Euros between 15,000 and 140,000)? Easy. We write a loop.

In practice, there’s a little timing issue between iterations, so I also needed to nick a very handy sleep function off Stack Overflow and put a very short delay after doing the keyboard input, to give it time to update the output values.

const puppeteer = require('puppeteer');

function sleep(ms) {
  return new Promise(resolve => setTimeout(resolve, ms));
}

(async () => {
  const browser = await puppeteer.launch();
  const page = await browser.newPage();
  await page.goto('http://maltasalary.com/');
  
  console.log('Gross Net');
  
  for (var grossSalary = 15000; grossSalary <= 140000; grossSalary += 1000) {
    // Gross salary - keyboard input
    await page.focus("#salary");
  
    for (var i = 0; i < 6; i++)
      await page.keyboard.press('Backspace');
  
    await page.keyboard.type(grossSalary.toString());
    await sleep(10);
  
    // Net salary
    const netSalaryElement = await page.$('.net-yearly-result');
    const netSalary = await page.evaluate(element => element.textContent, netSalaryElement);

    console.log(grossSalary, netSalary);
  }

  await browser.close();
})(); 

This has the effect of outputting a pair of headings (“Gross Net”) followed by gross and net salary pairs:

Outputting the gross and net salaries in steps of 1,000 Euros (gross) at a time.

Making a Graph

Now that we have a program that spits out pairs of gross and net salaries, we can make a graph out of this data. First, we dump all this into a file.

node netsalary.js > malta.csv

Although this is technically not really CSV data, it’s still very easy to open in spreadsheet software. For instance, when you open this file using LibreOffice Calc, you get the Text Import screen where you can choose to use space as the separator. This makes things easier given that the net salaries contain commas.

Choose Space as the separator to load the data correctly.

Once the data is in a spreadsheet, producing a chart is a relatively simple matter:

Graph showing how net salary changes with gross salary in Malta.

Now, this graph might look a little lonely, but you can already gather interesting insight by noticing its gradient and the fact that it isn’t entirely straight.

After doing this exercise for multiple countries, it’s fascinating to see how their lines compare when plotted on the same chart.

Aside from the allure of data analysis, I hope this article served to show how easy it is to use Puppeteer to perform simple browser automation, beyond the obvious UI automation testing.

A Gentle Introduction to Gulp

We’re at the end of 2015, and web technology has changed quite  a bit since I started in 2002. Nowadays, for the front end stuff, there is a whole family of tools based on the node.js package manager (npm) that you can use to streamline and automate your workflow.

In this article (based on Windows), we’ll learn to use Gulp to do routine tasks such as concatenating and minifying JavaScript tasks. There’s another tool called Grunt with a similar purpose, and you’ll find all sorts of discussions on the internet comparing Grunt vs Gulp. Basically, Grunt is the older of the two and has a bigger community – an important factor considering that these tools are plugin-driven. However, I’m covering Gulp here as I felt it was more intuitive. For this small demonstration it has all the plugins we need, and performance (a common point of comparison) isn’t even a factor.

Setting up Gulp

The first thing we need is to install node.js:

install-nodejs

There’s a chance you might already have node.js, if you installed it with Visual Studio 2015.

Once you have installed node.js, you should have npm in your path. Open a command prompt, and install Gulp using the following command:

npm install gulp -g

-g means globally, and thanks to this, gulp should now be in your path.

Next, we want to create a package.json file. This is a kind of project file for node.js-related stuff. We can use npm for this too:

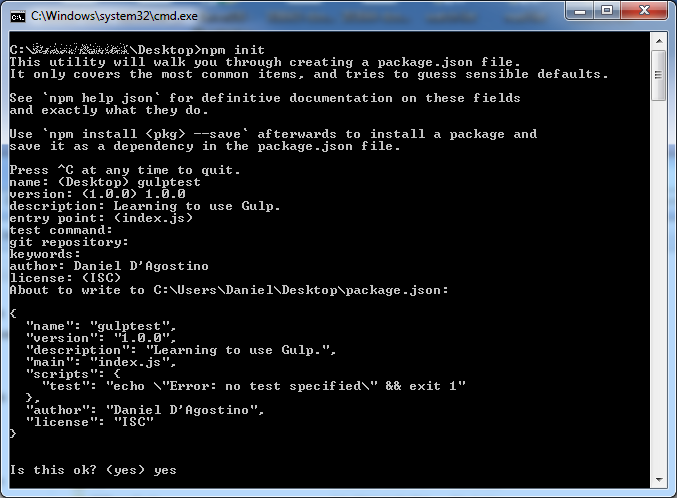
npm init

npm will ask a bunch of questions in order to set up the package.json file, suggesting possible answers where it makes sense to do so. name and version are required, but you can leave the rest empty if you like:

npm-init

Next, we need to install Gulp locally in our project:

npm install gulp --save-dev

This installs Gulp; –save-dev updates the package.json with a devDependencies field:

{
  "name": "gulptest",
  "version": "1.0.0",
  "description": "Learning to use Gulp.",
  "main": "index.js",
  "scripts": {
    "test": "echo \"Error: no test specified\" && exit 1"
  },
  "author": "Daniel D'Agostino",
  "license": "ISC",
  "devDependencies": {
    "gulp": "^3.9.0"
  }
}

Plugins and the Gulp file

Gulp itself doesn’t do anything; it is just configured to run tasks. Its capabilities come from the plugins you install, and you configure it to do stuff using a Gulp file. For this simple example, we’re just going to use a few plugins:

npm install gulp-concat gulp-uglify --save-dev

Once again, –save-dev updates your devDependencies in package.json:

  "devDependencies": {
    "gulp": "^3.9.0",
    "gulp-concat": "^2.6.0",
    "gulp-uglify": "^1.5.1"
  }

Next, create a file called gulpfile.js, and put the following code in it:

var gulp = require('gulp'),
    uglify = require('gulp-uglify'),
    concat = require('gulp-concat');
    
gulp.task('default', function() {
  return gulp.src('js/*.js')
    .pipe(concat('all.js'))
    .pipe(gulp.dest('dist/'));
});

To test this out, I downloaded jquery and jquery-ui, and put the uncompressed Javascript files in a “js” folder. Having created the Gulpfile above, all you need is to run Gulp:

gulp

You should find a folder called dist, with a file called all.js in it, containing the contents of the files originally in the js folder:

gulp-concat

Concatenating JavaScript is good for performance because the browser only needs to make a single request, rather than having to retrieve several small files. But we can do even better by minifying the JavaScript (using the gulp-uglify plugin). Just add the following line:

var gulp = require('gulp'),
    uglify = require('gulp-uglify'),
    concat = require('gulp-concat');
    
gulp.task('default', function() {
  return gulp.src('js/*.js')
    .pipe(concat('all.js'))
    .pipe(uglify())
    .pipe(gulp.dest('dist/'));
});

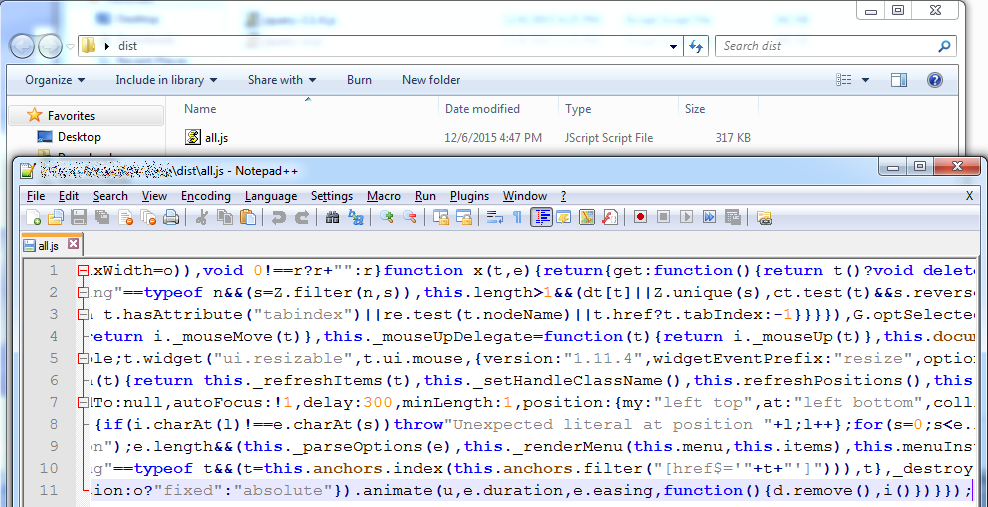
Run Gulp again, and you’ll find that all.js has been updated. In fact, it’s much smaller now, and it’s completely illegible:

gulp-uglify

Conclusion and Further Reading

The purpose of this article was to get you set up with Gulp, and see something working with the least possible hassle. Mark Goodyear’s article (on which this article is partly based) covers a lot of other common operations to carry out with Gulp. If you need to do anything particular – linting your JavaScript files, minifying your CSS, using Less, etc, there’s probably a plugin for it.

Beyond that, all you need to know is how to use Gulp effectively as part of your build process.

  • Running Gulp without arguments makes it look for the “default” task. You can pass the name of a task to run as an argument, allowing you to run a variety of operations.
  • How do you debug your minified JavaScript? You don’t. Use separate tasks for development and for release, and minify only in your release task.
  • Ideally these tasks should be run automatically as part of your continuous integration.
  • An ASP .NET 5 (formerly known as vNext) project in Visual Studio 2015 can easily integrate with npm tools, and you can configure it to run your tasks when you build.
  • Not using Windows? These command line tools are easy to use on other platforms (although installing npm will obviously be different).

Update 8th January 2016: Check out “More Gulp in Practice“, the followup to this article.