Update 29th December 2015: As noted in the comments, the API has changed since I wrote this article, and some methods have been deprecated. See the new section at the end for updated full source code. The rest of the article has not yet been updated.
There are many ways to debug and inspect a live process or a crash dump. Unfortunately, many of these are very low-level and can be a bit of a nightmare to use. However, a relatively new library called ClrMD, released in beta 2 years ago, provides a convenient abstraction and makes it much easier to do this kind of work.
You can install the ClrMD NuGet package from the NuGet package manager. However, since this is still prerelease software, you’ll need to enable the option to include prerelease packages:
Once you have that installed, you can use ClrMD via the following namespace:
using Microsoft.Diagnostics.Runtime;
In this example, we’ll attach to a running process, but ClrMD also allows you to inspect a crash dump. In order to attach, we need the process id (PID). You can get this either from Task Manager…
…or by looking for the process in code (needs System.Diagnostics):
            var process = Process.GetProcessesByName("Dandago.Mail.ImapTalk").FirstOrDefault();

            if (process != null)
            {
                int pid = process.Id;

                // TODO rest of code goes here
            }
            else
                Console.WriteLine("Process not found!");
Once you have the PID, you can attach to the process as follows.
                const int timeout = 5000;

                using (var dataTarget = DataTarget.AttachToProcess(pid, timeout))
                {
                    // TODO rest of code goes here
                }
Before you can inspect objects in memory, you need to get your hands on the heap in the process you attached to. To do this, we need to go through the following steps:
- Get the CLR runtime version(s) loaded in the process.
- From that, get this library called DAC (Data Access Component, implemented in mscordacwks.dll), which provides debugging functionality.
- Based on this, we can create an instance of
ClrRuntime. - From
ClrRuntime, we get aClrHeap.
These steps are performed in the code below:
                    var clrVersion = dataTarget.ClrVersions.FirstOrDefault();
                    string dacLocation = clrVersion.TryGetDacLocation();
                    var runtime = dataTarget.CreateRuntime(dacLocation);
                    var heap = runtime.GetHeap();
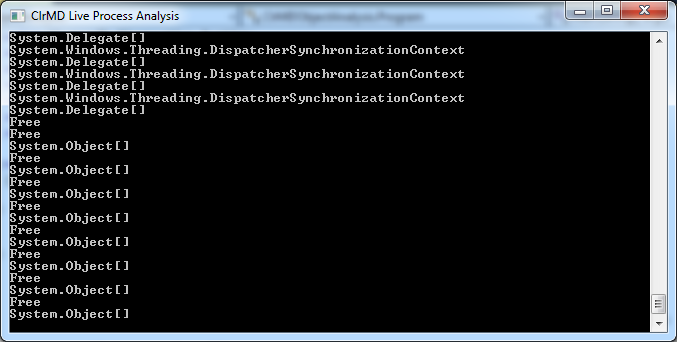
ClrHeap gives us a handy EnumerateObjects() method that allows us to see all the objects in memory. If we want to just get a list of all of them, it’s a simple matter to iterate through them and write out their types:
                    foreach (var obj in heap.EnumerateObjects())
                    {
                        var type = heap.GetObjectType(obj).Name;
                        Console.WriteLine(type);
                    }
This gives us a long list of object types in memory:
There are lots of things we can do with these objects. As a slightly more elaborate example, we can see a list of types ordered by the most common:
                    var types = heap.EnumerateObjects()
                        .GroupBy(obj => heap.GetObjectType(obj).Name)
                        .Select(group => new { Key = group.Key, Count = group.Count() })
                        .OrderBy(type => type.Count);

                    foreach(var type in types)
                        Console.WriteLine("{0} {1}", type.Key, type.Count);
The output is thus:
Further Reading
- .NET Crash Dump and Live Process Inspection – MSDN article about ClrMD.
- ClrMD homepage at GitHub, includes tutorials.
- Profiling (Unmanaged API Reference) – another API for process inspection, for masochists.
Full Source Code
        static void Main(string[] args)
        {
            Console.Title = "ClrMD Live Process Analysis";

            var process = Process.GetProcessesByName("Dandago.Mail.ImapTalk").FirstOrDefault();

            if (process != null)
            {
                int pid = process.Id;
                const int timeout = 5000;

                using (var dataTarget = DataTarget.AttachToProcess(pid, timeout))
                {
                    var clrVersion = dataTarget.ClrVersions.FirstOrDefault();
                    string dacLocation = clrVersion.TryGetDacLocation();
                    var runtime = dataTarget.CreateRuntime(dacLocation);
                    var heap = runtime.GetHeap();

                    var types = heap.EnumerateObjects()
                        .GroupBy(obj => heap.GetObjectType(obj).Name)
                        .Select(group => new { Key = group.Key, Count = group.Count() })
                        .OrderBy(type => type.Count);

                    foreach (var type in types)
                        Console.WriteLine("{0} {1}", type.Key, type.Count);
                }
            }
            else
                Console.WriteLine("Process not found!");

            Console.ReadLine();
        }
Full Source Code after API Change
Update 29th December 2015: the API changed since this article was written, and some methods have been deprecated. The full code below is an updated version to work with version 0.8.31-beta of ClrMD.
        static void Main(string[] args)
        {
            Console.Title = "ClrMD Live Process Analysis";

            var process = Process.GetProcessesByName("Dandago.Mail.ImapTalk").FirstOrDefault();

            if (process != null)
            {
                int pid = process.Id;
                const int timeout = 5000;

                using (var dataTarget = DataTarget.AttachToProcess(pid, timeout))
                {
                    var clrVersion = dataTarget.ClrVersions.FirstOrDefault();
                    string dacLocation = dataTarget.SymbolLocator.FindBinary(clrVersion.DacInfo);
                    var runtime = clrVersion.CreateRuntime(dacLocation);
                    var heap = runtime.GetHeap();

                    var types = heap.EnumerateObjectAddresses()
                        .GroupBy(obj => heap.GetObjectType(obj).Name)
                        .Select(group => new { Key = group.Key, Count = group.Count() })
                        .OrderBy(type => type.Count);

                    foreach (var type in types)
                        Console.WriteLine("{0} {1}", type.Key, type.Count);
                }
            }
            else
                Console.WriteLine("Process not found!");

            Console.ReadLine();
        }


