Those Kibana users who prefer their software with a dark theme will be thrilled to know that Kibana actually does have a dark mode since version 7.0.0.
It can be enabled by following the steps illustrated below.
Go to Management from the left navigation.
Select Advanced Settings on the left.
Find the Dark mode setting somewhere further down in the page.
Switch on the Dark mode setting, then reload the page.
Like the sky on a stormy day, the page goes dark.
In fact, everything from Discover to Maps (and beyond) becomes dark.
Dark mode is a welcome feature for those who prefer darker tones on their screen as a matter of personal taste or to reduce eye strain.
AWS Lambda functions are great for simple logic running periodically (among other things). In this article, we’ll create a simple AWS Lambda function in Python that retrieves stock prices from a REST API every minute. Let’s get straight to it!
Create a Lambda Function
First, we need to create a function. Follow the instructions illustrated below to do this.
From the AWS Console dashboard, locate the Lambda service. You can also do this via the Services drop-down panel at the top, or from your recently visited services (if you’ve already been using Lambda).Once you are in the Lambda service, create a new function by clicking on the “Create a function” button as shown above.Choose a name for the Lambda function, and also the runtime. We’re using Python 3.7 (which is the latest supported Python version in AWS Lambda at the time of writing this) for this example, but other options are available (e.g. Node.js, NET Core, Go, etc). Leave everything else as is and hit the Create function button.Once the Lambda is created, you are taken to the new function itself. A green status message at the top indicates that it has been created successfully.
Editing the Lambda’s Code
The function’s configuration screen can seem quite confusing at first, but all you need to do is scroll down to get to the code editor. While there are a few different ways to add code to your Lambda, using the provided editor (which is the default option for Python) is the easiest.
Replace the default code in the editor with the following, and hit the Save button at the top-right.
from urllib.request import urlopen
from contextlib import closing
import json

def lambda_handler(event, context):
    with closing(urlopen("https://financialmodelingprep.com/api/v3/stock/real-time-price/GOOGL")) as responseData:
        jsonData = responseData.read()
        deserialisedData = json.loads(jsonData)
        price = deserialisedData['price']
        print(price);
    return price
Next to the Save button at the top-right, there’s a Test button. Click it, and the following screen comes up.
The Configure test event screen. Just enter a name and hit Create.
Just enter a name (e.g. “Test”) and hit the Create button further below. We’re not using the input JSON data, so you can just ignore it.
Next, click the Test button at the top-right again, and your Lambda function will be executed:
After clicking Test again, the lambda is executed and the results are shown below the code.
The results are shown below the code, and these include various metadata (such as a Request ID and execution time) as well as Google’s stock price of 1082.38, which we retrieved from the REST API and logged using the print statement in the code.
Running Periodically
We now have a working Lambda function, but so far we have to invoke it manually every time. Let’s set it up so that it runs every minute.
At the top of the screen, click CloudWatch Events on the left to add a CloudWatch trigger.
Scroll back to the top, and you’ll see a placeholder telling you to “Add triggers from the list on the left“. Following that advice, click on “CloudWatch Events” to the left.
A CloudWatch Event trigger is added to the function.
This has the effect of adding “CloudWatch Events” as a trigger in the slot where the placeholder text was, but what you might not notice at first is that the lower part of the page changes from the code editor to a “Configure triggers panel“. This can be quite confusing for those new to AWS Lambda who might not intuit right away that clicking on the boxes will affect the content in some other part of the page.
By scrolling down, we can configure the new trigger.
Here we use a Schedule expression of rate(1 minute) to make the function run every minute.
Filling in most of the settings (e.g. choosing a name) is easy, bearing in mind that there are some restrictions (e.g. some characters, such as spaces, are restricted in the name).
The only tricky part is where we specify how frequently we want the function to be executed. For this, we can use cron or rate expressions (refer to AWS documentation: Schedule Expressions Using Rate or Cron). By using an expression of rate(1 minute), we configure the function to run every minute, which is the smallest supported interval.
Once this is all set up, click the Add button to set up the trigger. Then, don’t forget to click the Save button at the top-right of the page to apply the changes to the Lambda function.
Checking Output in CloudWatch
After waiting a few minutes for the function to run a few times, we can go into CloudWatch and check the output of each execution.
CloudWatch logs.
From the AWS Services, locate CloudWatch. Go into Logs from the left menu, and locate the log group for our Lambda function (in this case it’s /aws/lambda/StockChecker).
Select the most recent log stream (the one at the top), and if you scroll to the end, you should see logs showing the function’s execution every minute, as well as whatever we’re writing to standard output (in this case, Google’s stock price).
CloudWatch logs show that the Lambda function is executing every minute.
We can see that the function is executing every minute, and we’re logging a stock price each time. The US stock market is closed right now, and that’s why the stock price is always the same (you’d expect it to change frequently when the market is active).
Conclusion
At this point, we have a simple, working AWS Lambda function (written in Python) that runs every minute and retrieves Google’s stock price. To keep things simple, we’re just writing it to standard output, which means we can see the value in CloudWatch – but we could also expand the code to build something useful from this.
Angular is an open-source framework built and maintained by Google, which is mainly used to develop Single-Page Applications (SPAs). It provides a structured approach towards creating front-end web applications.
Originally known as AngularJS, the framework underwent a complete rewrite that resulted in Angular 2.0 (dropping the -JS suffix from the name). The versions that came after 2.0 (with Angular 8 being the latest, released just over two weeks ago) are incremental upgrades, thus it is possible to upgrade between them. However, AngularJS is a different beast and there is no easy way to upgrade from AngularJS from Angular 2.0+.
In this article, we’re going to go through the steps necessary to start working with Angular. In order to keep this concise, there won’t be a lot of background.
npm
On Windows, download the Node.js installer from their website. Either version should be fine to get started.
The first thing we need to do is get npm, a package manager for JavaScript libraries. On Windows, download and install Node.js. On Linux or Mac, use the relevant package manager for your system (e.g. apt-get on Linux Ubuntu), possibly along with the sudo command for elevated privileges, to install npm.
Angular CLI
The Angular CLI homepage shows the commands you need to set up and use the Angular CLI tools.
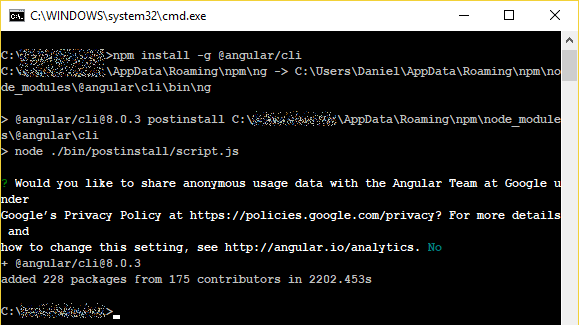
Next, we need the Angular CLI to help us with our development workflow. Use npm to install it as a global tool, as follows (prefix this with sudo if using Linux or Mac):
npm install -g @angular/cli
Using npm to install the Angular CLI.
ng is the command-line tool we just installed. Use ng --version to make sure it’s in working order:
After executing ng --version, we can see some “Angular CLI” ASCII art and other information. This means that it’s working fine.
Creating a Project
Use ng new to create an Angular app from a template. You’ll be asked some questions to determine what features you need, but for now just press ENTER at each question to use the defaults.
ng new myproject
ng new myproject creates a folder called myproject with the Angular files in it. Press ENTER when asked questions to use defaults for now.
Note: when I first ran this, I got an error along the lines of “EPERM: operation not permitted, unlink“, even when using an elevated command prompt. The problem was likely caused by an old version of npm I had on my machine before, and I fixed it by running npm cache clean --force.
Running the application
Go into the project directory you’ve just created (e.g. myproject), and use ng serve to run the web application you just generated:
cd myproject
ng serve
ng serve runs a web server that you can use to access the running web application. Look in the output for the endpoint to use in your browser.
When ng serve is done building the project, it runs a web server hosting the web application. The output tells you where to access it, in this case http://localhost:4200/. Put that in your browser’s address bar, and you should see the homepage from the project template that we set up earlier:
A simple page shows us that Angular is in fact working.
Data Binding Illustration
We’ve created and run a web application using Angular, so we’re done in terms of getting started. However, let’s make a small change to the web application to get a little more comfortable with it and see something working.
Visual Studio Code is a popular choice for frontend development, despite having been made by Microsoft.
With ng serve still running, locate the src/app directory under your project’s root directory. Using a text editor or IDE of your choice, add the lines highlighted below to app.component.html:
<!--The content below is only a placeholder and can be replaced.-->
<div style="text-align:center">
  <h1>
    Welcome to {{ title }}!
  </h1>
  <img width="300" alt="Angular Logo" src="data:image/svg+xml;base64,PHN2ZyB4bWxucz0iaHR0cDovL3d3dy53My5vcmcvMjAwMC9zdmciIHZpZXdCb3g9IjAgMCAyNTAgMjUwIj4KICAgIDxwYXRoIGZpbGw9IiNERDAwMzEiIGQ9Ik0xMjUgMzBMMzEuOSA2My4ybDE0LjIgMTIzLjFMMTI1IDIzMGw3OC45LTQzLjcgMTQuMi0xMjMuMXoiIC8+CiAgICA8cGF0aCBmaWxsPSIjQzMwMDJGIiBkPSJNMTI1IDMwdjIyLjItLjFWMjMwbDc4LjktNDMuNyAxNC4yLTEyMy4xTDEyNSAzMHoiIC8+CiAgICA8cGF0aCAgZmlsbD0iI0ZGRkZGRiIgZD0iTTEyNSA1Mi4xTDY2LjggMTgyLjZoMjEuN2wxMS43LTI5LjJoNDkuNGwxMS43IDI5LjJIMTgzTDEyNSA1Mi4xem0xNyA4My4zaC0zNGwxNy00MC45IDE3IDQwLjl6IiAvPgogIDwvc3ZnPg==">
  <input type="text" [(ngModel)]="name" />
  <br />{{ name }}
</div>
<h2>Here are some links to help you start: </h2>
<ul>
  <li>
    <h2><a target="_blank" rel="noopener" href="https://angular.io/tutorial">Tour of Heroes</a></h2>
  </li>
  <li>
    <h2><a target="_blank" rel="noopener" href="https://angular.io/cli">CLI Documentation</a></h2>
  </li>
  <li>
    <h2><a target="_blank" rel="noopener" href="https://blog.angular.io/">Angular blog</a></h2>
  </li>
</ul>
Then, add the lines highlighted below to app.module.ts:
import { BrowserModule } from '@angular/platform-browser';
import { NgModule } from '@angular/core';
import { FormsModule } from '@angular/forms';

import { AppComponent } from './app.component';

@NgModule({
  declarations: [
    AppComponent
  ],
  imports: [
    FormsModule,
    BrowserModule
  ],
  providers: [],
  bootstrap: [AppComponent]
})
export class AppModule { }
When ng serve detects these changes, it should reload the web application (in your browser) automatically, so you don’t need to stop and start it again whenever you change something.
We’ve added the text input box under the image. When you type in it, the text below it is automatically updated accordingly.
Thanks to the changes we made, we now have a text input box under the Angular logo. When you type in it, the text below it is synchronised with it.
The changes we made might seem alien at first, but we’ve actually used two important features of Angular: data binding and string interpolation. While explaining these is beyond the scope of this introductory article, I hope that seeing this power at work — with such a small change — has given a taste of why Angular is so useful.
On Thursday 25th April 2019, just two days ago, the Elastic team held the Elastic Stack 7.0 Live (Virtual) Event, in which they explained and showcased several of the features in the latest version of Elasticsearch and its accompanying tools that were released on 10th April.
A recording is available at the link above, and I highly recommend watching it. However, I am writing this summary for the sake of those who might want to quickly check out the highlights without spending close to two hours watching the recording, or for those who want to quickly locate some of the relevant information (video isn’t a great medium to search for info).
Overview
“This version of the Elastic Stack looks very different from our early releases. It’s […] a much more mature product. We’ve had… 7 years now to learn and grow. But really we’re still focusing on the same 3 principles that have made Elastic popular from the beginning: speed, scale and relevance.”
— Clint Gormley, Stack Team Lead
The Elastic team has invested a lot of work into making Elasticsearch easy to scale, in such a way that it works the same on a laptop and in a data centre with hundreds of nodes with minimal configuration. However, the harsh realities of distributed systems (disk corruptions, split brains, shard inconsistencies etc) make this a very hard problem to solve, and the team has over the years added incremental changes to improve the product’s resiliency.
It is this work that has led to cross-cluster replication (released in 6.5), the removal of the minimum master nodes setting (released in 7.0), and will also enable following a stream of changes as they happen in an index.
“Version 7 is the safest, most flexible, easiest to use and scalable version of Elasticsearch that we’ve ever delivered.”
— Clint Gormley, Stack Team Lead
Fundamental changes have also been made in the way search itself works. Elasticsearch 7.0 uses an algorithm called Block Max WAND to greatly improve the speed of queries at the cost of not knowing exactly how many documents matched. This is usually a reasonable tradeoff because people usually want to get the top N results, rather than knowing the total hit count.
The raw speedup given by this new algorithm also has implications in terms of relevance of results and usability. Because search is so fast, it is no longer costly to search for stop words, and thus precision and recall can be improved by including them. Work is also ongoing on a search-as-you-type feature that would not be possible without this new level of performance.
Using BKD-trees instead of inverted indices have also resulted in significant speedups, especially in the realm of geo-shapes where accuracy has also improved considerably as a result.
Kibana got a new design, as its role has grown from being used to visualise Elasticsearch data to becoming an all-encompassing tool to manage the Elastic stack.
Also new on the ingest side is something called the Elastic Common Schema, which is a consistent way to map similar data from different data sources (e.g. Apache, IIS, NGINX) into a single structure.
Kibana 7 Design Considerations
A demo of Kibana 7, both in a browser and a mobile simulator.
Kibana 7 sports a new design as a result of a design-at-scale problem. The number of services offered by Kibana (see the tab drawer to the left) has increased considerably, and this called for a consistent and usable layout that could cater for applications as diverse as maps and logging.
Kibana’s dark mode, making the logging UI look like a terminal.
Some of the more superficial (but by no means trivial) work that went into Kibana was related to making it responsive (i.e. it responds nicely when you resize the browser window) and mobile-friendly (which in the words of Dave Snider, Director of Product design, is still “pretty beta”), as well as the dark mode that applies a darker theme throughout the product.
More importantly, however, Kibana 7 wants users to focus on the content (search results, graphs, visualisations etc) rather than the Kibana tooling itself, and that means moving things like the date picker and even Kibana’s own navigation out of the way.
The new design is based on a set of values:
Accessible to everyone (colour-blindness, screen reader support, tab around without using a mouse, etc)
Themable (easy to change colours)
Responsive (works in different screen sizes)
Playful (make it feel like fun – lively animations and such)
Well-documented (important for a distributed and open-source company)
This design was achieved by building the Elastic UI Framework, a React and CSS library of all UI controls used to build Kibana. It is open-source and fully documented with demos.
Making Search Faster (and Easier)
An example from the demo showing a stop word query from two fields returned in 27ms, but did not return an accurate hit count.
The Block Max WAND algorithm makes search significantly faster when we don’t need the total hit count. A demo showing a query involving stop words showed that the search took more than 10 times as long without this optimisation as it did with it.
The same search, run with track_total_hits set to true. This gives an accurate total hit count, but the query is significantly slower.
The Block Max WAND optimisation, enabled by default in Elasticsearch 7.0, can be disabled at any time using the track_total_hits setting if an exact hit count is required. It is also disabled automatically when using aggregations, to which the optimisation cannot be applied. Even with the optimisation enabled, total hits are tracked up to a maximum of 10,000. You can tell whether the hit count is accurate or not by seeing whether the hits.total.relation value is “eq” (which means it’s accurate) or “gte” (which means the actual hit count will be greater than or equal to 10,000).
This ground-breaking enhancement to the way search works is beneficial not only in speeding up queries, but also in enabling new features. In fact, a search-as-you-type feature is under development and is planned for the 7.1 release. Aside from that, feature fields and interval queries are also mentioned in the presentation.
Cluster Resiliency and Scale
The role of the Cluster Coordination Subsystem.
Elasticsearch 7 brings with it a new cluster coordination subsystem, which is responsible for the ongoing healthy operation of an Elasticsearch cluster. This has led to the removal of the minimum_master_nodes setting, which could prove very painful pre-7.0. Master elections are also a lot faster (going from at least 3 seconds in pre-7.0 to a few hundred milliseconds in 7.0), and logging is available when things go wrong.
The new cluster coordination system has been verified using formal methods, typically employed in mission-critical systems. Also, upgrading to this new system can be done without downtime.
An important resiliency enhancement in 7.0 is the real-memory circuit breaker. Elasticsearch uses several circuit breakers, designed to push back on requests when under load to avoid out-of-memory errors. The new real-memory circuit breaker allows Elasticsearch to know exactly how much memory will be allocated, making it less likely to break while at the same time using less overhead.
Cross-cluster replication (which shares an acronym with Creedence Clearwater Revival) is production-ready in 7.0, and addresses a number of very real use cases.
Elasticsearch 7.0 also introduces production-ready cross-cluster replication, allowing changes to indices to be synchronised with remote Elasticsearch clusters. The slide shown above describes some use cases where this is useful.
Geo Gorgeous (i.e. Maps)
The support for geographical applications by Elasticsearch and Kibana has received a considerable boost in version 7. At a basic level:
geo_points and geo_shapes now fully use BKD-trees
Ingest nodes can now use the GeoIP processor, and Logstash has a geoip filter plugin
Kibana gets a Coordinate Map, Region Map, as well as Vega and Maps capabilities
A new geo_shape type makes geo_shape fields a lot easier to work with
Using BKD-trees for Geo Shapes yields incredible improvements.
The use of BKD-trees for Geo Shapes significantly reduces the complexity of their representation, and therefore their storage. This results in considerable speed (indexing and querying), space and accuracy improvements, as shown in the slide above (and further in the video).
Elasticsearch 7.0 also introduces the geo_tile aggregation, which (unlike the geo hashes in use so far) conforms to the Web Mercator specification. Grid tiles are thus actually square, and preserve identical aspect ratio at all scales and latitudes.
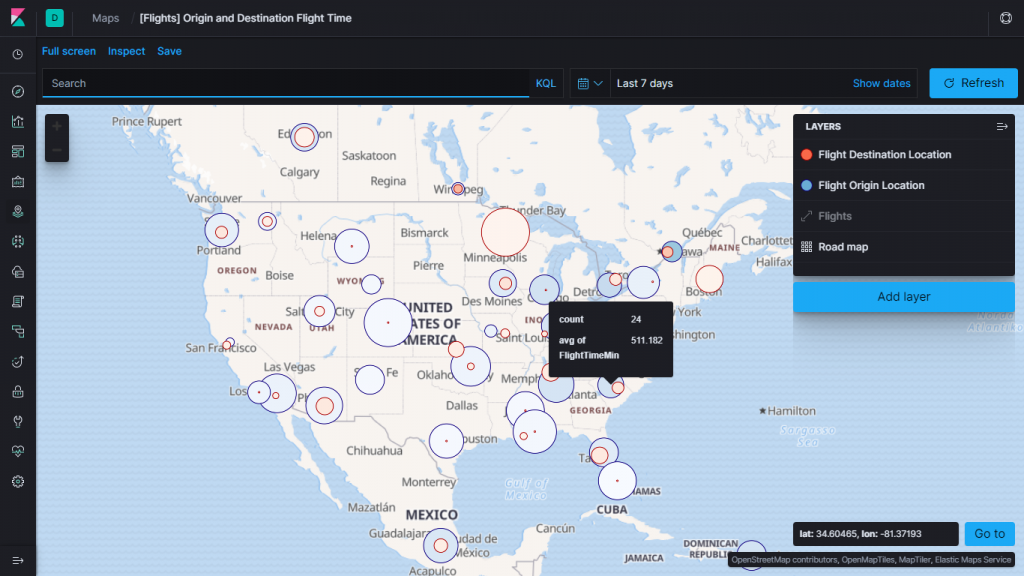
The rest of the presentation on geo focuses on Kibana Maps, which is beta in 7.0. It is a great tool allowing compisition of maps from multiple data sources, as the demo shows. The rest of the screenshots below are stills from the demo, and each demonstrates a particular functionality.
The demo is based on data that simulates network requests. A layer is added to the map based on the geographical location of each record, first as points, then as grid rectangles, and finally as a heat map.Another layer is added, bringing in countries from the Elastic Maps Service.Joining the point and country data results in country polygons shaded by the number of requests that originated there.It is possible to use a custom map service, as shown by this dark map coming from a third party source.Data centres (the big green circles) are added to the map.The location of individual requests (smaller green circles) are also added to the map, and gradually made smaller until they are barely visible.Request paths — lines connecting individual requests to data centres — are added as well.Since this is Kibana, the power of search is always available. The results are restricted to the last five minutes and to one particular data centre.
Summary (of the Summary)
Elastic Stack 7.0 is packed with new features and improvements. The launch event, still available on video and summarised in this article, barely scratches the surface. There is certainly a lot to be excited about.
Some items we’ve touched upon include:
Kibana has grown and got a redesign.
Block Max WAND significantly speeds up search (at the cost of total hit count), and paves the way for future features such as search-as-you-type.
A new cluster coordination subsystem, real-memory circuit breaker, and cross-cluster replication improve cluster resiliency and scale.
Significant improvements have been made in the geo space, and Kibana Maps is awesome.
Umbraco is a Content Management System (CMS) built on legacy ASP .NET (i.e. not .NET Core, and therefore Windows-only). A couple of months ago, version 8 was released, with breaking changes and some new features. In this article, we’ll see how to quickly get up and running with Umbraco 8.0.1 and Visual Studio Code.
Downloading Umbraco
The first thing to do is grab the Umbraco starter kit from the download page. At the time of writing this article, the latest version is 8.0.1.
The download link and installation guide link are shown in this screenshot.
Beneath the download link, there’s another link to the installation guide, which are mainly the steps we’ll be following in this article (despite the warning that it may not be updated for v8). Unfortunately, the “getting started” link further below (not shown in the screenshot above) is broken.
After downloading the Umbraco zip file, extract it to a folder of your choice.
Running Umbraco with Visual Studio Code
Visual Studio Code is a recent (compared to Visual Studio) cross-platform Integrated Development Environment (IDE) developed by Microsoft, and can often be used as a replacement for Visual Studio. Download Visual Studio Code if you don’t have it already.
Use the menu or the start page to “Open Folder…” and locate the directory where you extracted Umbraco.
After running Visual Studio Code, use its “Open folder…” option (via the start page or the file menu) to locate the folder where you extracted Umbraco to.
To install the IIS Express extension for Visual Studio: first, access the Extensions tab via the box-like icon on the left. Then, search for IIS Express, and select the relevant result when it comes up. Finally, hit the Install button.
Then, install the IIS Express extension for Visual Studio Code by following the steps illustrated in the above screenshot.
With that done, hit Ctrl+F5 to run the website. Be patient, as it may take a little while to load the first time.
PageInspector.Loader Assembly Issue
“Could not load file or assembly ‘Microsoft.VisualStudio.Web.PageInspector.Loader, Version=1.0.0.0, Culture=neutral, PublicKeyToken=b03f5f7f11d50a3a’ or one of its dependencies. The system cannot find the file specified.“
If you also have Visual Studio 2019 installed, then you might run into a problem that displays the above error instead of the website.
If this happens, locate the C:\ProgramData\Microsoft\VisualStudio\Packages\Microsoft.VisualStudio.AspNetDiagnosticPack.Msi,version=16.0.12311.10635 directory, run AspNetDiagnosticPack.msi, and hit Repair. After running the website again, it should work.
Installing Umbraco 8
After a little wait, the site should load and you should see the setup wizard:
The first page of the Umbraco setup wizard.
In the first screen (shown above), you give it your name, email address and a password. Then, you can choose whether to hit Install (which installs Umbraco with default settings, including an SQL Server Compact Edition (SQLCE) database), or else Customize and choose the options you want for the setup.
The installation itself will also take a while, but when that’s done, you’ll be redirected to the Umbraco CMS (which you can reach at any time via the /umbraco URL).
The login screen of the Umbraco CMS.
You can log in using the credentials that you supplied during the setup.
A first peek at the Umbraco 8 CMS: menu, navigation, content, and a tour.
Inside the CMS itself, you’ll get a quick tour of how the page layout is organised. If you’ve used Umbraco 7 or prior, you’ll notice that some things have been reorganised – for instance, the Developer section has been merged with the Settings section.
The Umbraco sample site that comes with the CMS download.
At this point, you can go ahead and start creating content. As you do this, you’ll see your changes reflected in the Umbraco Sample Site, which you can access by going to the root (/) of the website URL.
"You don't learn to walk by following rules. You learn by doing, and by falling over." — Richard Branson