Many of Malta’s government services can nowadays be accessed online. However, we still lag behind other countries in terms of their usefulness and ease of use. In this article, we’ll see a small example from the website of the Malta Public Registry that throws usability out of the window. As with other articles in The Sorry State of the Web series, and inspired by Vincent Flanders’ Web Pages That Suck, the aim is to learn good web design by looking at bad web design.
A screenshot of Certifikati.gov.mt, the website of the Malta Public Registry.
Certifikati.gov.mt is the website of the Malta Public Registry. I came across it a few days ago, and it has a simple and modern design, similar to many other contemporary websites. However, it makes one fundamental mistake that I haven’t seen in years, and you can see it in the navigation icons in the top-right corner of the website:
The icons in Certifikati’s navigation. Can you guess what they mean?
We have a row of icons, but what do they mean? We can perhaps try to guess, as some are more conventional than others (e.g. the shopping basket). But, to get a real idea of the range of information and services that a website offers, the only way is to hover over the icons one by one:
Hovering over an icon containing a sign post reveals that it means “Certificate Information”.
Aside from the questionable suitability of some of the icons, this kind of design is a tedious exercise in frustration, because instead of a website telling you clearly what it can do for you and where to find the information you want, you have to go and dig it up yourself, one icon at a time.
This is the first instance of Mystery Meat Navigation I’ve seen in many years. Although it used to be very common in the era of Geocities and Flash websites, the change in trend towards more minimal designs and ready-made templates over the course of 25 years thankfully seems to have caused it to fizzle out. As a result, I was very surprised to come across this clear example of regression.
It seems like most people have forgotten about the trap of Mystery Meat Navigation, and by writing about it again, I hope to raise awareness and help people avoid repeating the mistakes of the past.
Dealing with Air Malta is always quite frustrating, no matter what you need to do. After the ordeal of booking a flight, detailed in The Sorry State of Air Malta’s Website, it was finally time to catch that dreaded flight. This time, to mitigate potential issues with overbookings, I decided to check-in online.
So, I did what any reasonable person would do: I googled Air Malta’s online check-in, hoping to go straight there:
The first search result brought me to this form:
A friend of mine told me that the process is easy, and the form looked simple enough (as you can see above). What could possibly go wrong?
“Check-in System Error”, it said, “A system error has occurred. Please try again later.” Typical: they don’t tell you what the problem is, and you can try again as many times as you like, because it’s not going to work. Knowing Air Malta’s hatred of apostrophes, I tried my surname with and without the apostrophe, to no avail. I even tried to “Show Additional Options”:
Not only does “Show Additional Options” clear whatever you entered in the first two fields (so you’d have to type them in again if you wanted to go back to using the booking reference), but the 13-digit Ticket Number is nowhere to be found in the flight booking confirmation email.
Later, I figured out what the problem was. If you go to the Air Malta website and proceed to do the online check-in from there, you get to a completely different form which does actually work (except that when you get to the summary, it displays the wrong number of luggages):
What this probably means is that during some rebranding exercise, they set up a new online check-in form, but left the old and dysfunctional one in place, and Google still ranks that as number one.
It’s rather silly to assume that people will reach your website through its homepage. As it turns out, though, Air Malta are not alone. Just today, I wanted to find some recent news on the website of stockbrokers Rizzo, Farrugia & Co. (who, unlike Air Malta, I highly respect), so I did the same thing and googled it:
Clicking on the top result, I ended up here:
Even if you haven’t been to their website before, it’s pretty clear to see that the formatting is a bit of a mess (and doesn’t fit the style of the rest of the site), the dates are in the future, and the download links take you back to the same page. The reason for this is likely the same as with Air Malta’s online check-in: they had some old page that they abandoned in favour of new pages, and forgot to remove it. Or maybe it wasn’t an old page, but one that came back from the future!
To conclude: in the last article about Air Malta’s website, I highlighted the importance of empathy and understanding the journey that the user takes. Here, we’ve seen how the journey doesn’t always start at the homepage, so it’s important to (a) make sure that pages are accessible and functional even when accessed from search engines, and (b) take down any obsolete pages so that they don’t confuse users.
Air Malta is a real mess, but let’s face it: if you live in Malta, for some destinations, you don’t really have any choice but to fly with them. In this article, I’m not going to talk about Air Malta’s long-standing financial woes, their shady practice of overbookings, or their customer service (or lack thereof), none of which have improved over the years.
Instead, in the spirit of the Sorry State of the Web series, I’m going to talk about the simple journey of booking a flight, in the hope that we can learn a thing or two about user experience in the process.
Selecting a flight on AIr Malta’s homepage.
We start off by selecting a flight on Air Malta’s website, which has been redesigned in recent years and looks nice and modern. After selecting the departure and arrival airports and dates, we click on “Find flights”. So far so good.
Can’t Go Back
Oops! There’s no flight on one of the selected dates.
The dates I happened to choose at random included one with no flights available. Instead of picking one from the grid shown in the screenshot above, I preferred to go back and start over. Except that I couldn’t, because there’s some redirect in place that breaks the Back button and brings me back here every time.
Service Charge for No Refund
Okay, so I went back to the homepage and started over, selecting different airports and dates, and making it a one-way flight. This time, I have a choice of flights on the same day, and I can pick between three different fares:
Go Light is Non-Refundable (less €19 service fee).
It seems that Air Malta adapted to the uncertainty of COVID19 by providing varying levels of refundability to their flights depending on the option chosen. In each case, you pay a €19 service fee, including when the flight is non-refundable. Wait what?
Illegal Surnames
Your name is not allowed to have an apostrophe, and you can bring a weightless luggage. The name shown is fictional.
I have a long history of airlines and other websites either not accepting my surname or replacing apostrophes with the HTML entity '. Well, we’re in 2023 and Air Malta still thinks we’re not allowed to have apostrophes in our surnames, even though governments have been perfectly happy to accept them for centuries.
As I wrote in earlier editions of the Sorry State of the Web series, this bullshit is just a case of excessively restricted validation. Any concern about the use of apostrophes for SQL injection is easily dismissed by the fact that nowadays we have (and use… yeah, right) prepared statements.
In fact, I found that characters with diacritics (such as French accents or German umlauts) are also excluded from Air Malta’s definition of “alphabetic characters”:
Your surname can’t have accents either.
Fortunately, I’m not the only one experiencing the frustration of an unacceptable surname on a regular basis. It turns out there’s a “Your Name Is Invalid!” Twitter account which regularly posts similar episodes.
Weightless Luggage
If you look on the right-hand-side of the two screenshots above, you’ll notice that there’s a “1 x 0kg (included)” luggage listed. Perhaps it’s a new offer from Air Malta: bring your hand luggage on board for free, as long as it’s weightless!
Successful Payment
I’m supposed to be redirected… but I’m not!
After paying for the flight, I’m taken to this page with a browser title saying “APCO_AUTH_SUCCESS”. It’s got what seems to be XML in the URL’s querystring, presumably the type of SOAP message that people used to coordinate war efforts during the Crusades.
The page also says “Your payment was successful, you are now redirected to the Confirmation page”. No I’m not! The page doesn’t budge and I’m just stuck here.
Conclusion
It takes more than a fancy website to create a good user experience. Despite my aversion to Air Malta, this is also true of many other websites and web applications, especially in Malta where the bar is rather low.
The most important thing when developing a website or web application is to test it. Everything I’ve shown in this article is easily spotted simply by using the website, following a pretty ordinary journey through the booking process. All these things could have been caught by a developer or an Air Malta employee before reaching customers like me.
Another piece of advice around user experience is to have some empathy. Put yourself in the shoes of the customer. Is your obsession with alphabetic characters going to win any points with a customer simply trying to enter their name? Probably not.
Let’s learn something from this and try to improve. That way we can have happier customers and happier businesses.
Visual Studio Code (VS Code) is a wonderful IDE. I’m not generally known to praise Microsoft’s products, but VS Code lets me develop and debug code productively in all the languages I’ve needed to work with, on any operating system. I don’t even use Visual Studio any more.
Launch configurations are at the heart of debugging with VS Code. In this article, I’ll explain how you can debug code using different languages, even at the same time. I’ll also show you how you can customise these launch configurations to pass command-line arguments, set environment variables, run pre-launch tasks, and more.
Getting Started with Launch Configurations
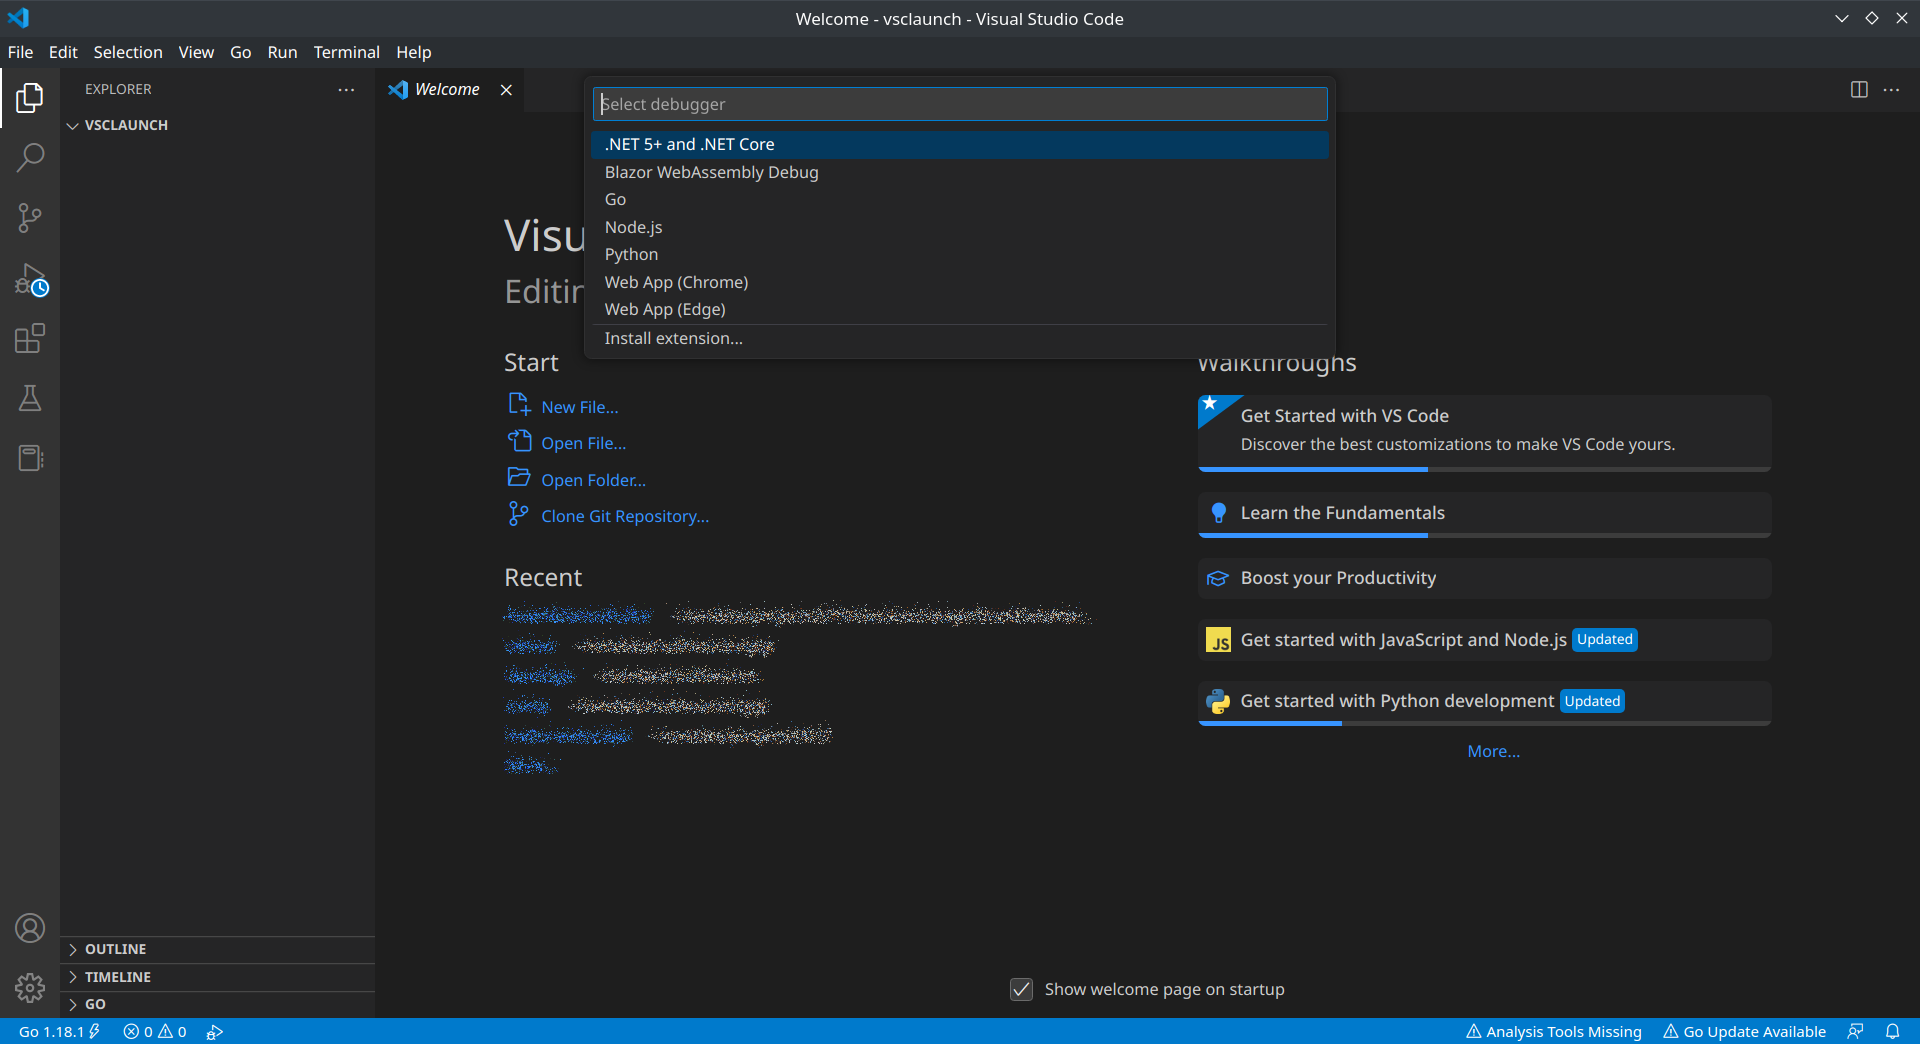
Anytime you want to debug something, you just press F5 (like in Visual Studio). Initially, you probably won’t have any launch configurations set up, in which case you’ll be prompted to choose what kind of launch configuration you want to create, as shown in the screenshot below. This list might vary depending on the language runtimes you have installed. When you select one, you’ll be guided towards creating a sample launch configuration.
Pressing F5 brings up a list of languages for which you can create launch configurations.
Another way is to click on the Debug tab on the left, which looks like a play button. You can then click the link to “create a launch.json” file, shown in the screenshot below. We’ll see this in practice in the next sections as we create launch configurations for various languages.
The Debug tab allows you to “create a launch.json file”.
Debugging Python
Before we debug anything, we need some code. Let’s add a folder with a Python file in it, and add the following code:
import time
import datetime

while True:
    time.sleep(1)
    print(f"Swiss church bells say it's {datetime.datetime.now()}")
If I press F5, this actually works for me out of the box:
Pressing F5 runs the Python program and lets us debug it.
Clicking next to a line number adds a breakpoint. When the program hits that point, it pauses and allows us to inspect variables and other things. You can press F10 to go to the next statement, F11 to step into a function call, and Shift+F11 to step out. While a tutorial on how to debug code is outside the scope of this article, if you’re unfamiliar with debugging, this should at least be enough to get you started.
After hitting a breakpoint in the Python program, we can advance step by step and see the state of local variables.
A Launch Configuration for Python
Follow either of the methods in the earlier “Getting Started” section to create your first Python launch configuration. This creates a launch.json file under a .vscode folder with the following contents. As launch.json may contain personally customised configurations for different developers (e.g. with different input parameters), it’s best not to commit it to source control.
{
    // Use IntelliSense to learn about possible attributes.
    // Hover to view descriptions of existing attributes.
    // For more information, visit: https://go.microsoft.com/fwlink/?linkid=830387
    "version": "0.2.0",
    "configurations": [
        {
            "name": "Python: Current File",
            "type": "python",
            "request": "launch",
            "program": "${file}",
            "console": "integratedTerminal",
            "justMyCode": true
        }
    ]
}
There isn’t much to it: this will simply run whatever file you have open in VS Code (which is what ${file} means). This is useful if you want to run specific files (I do this with tests in Go for instance), but not so much if you have a program with a single entry point and want to run that regardless of what you have open in VS Code. In that case, it’s easy to change the program value:
${workspaceFolder} represents the folder we have open in VS Code, so this makes sure we’re relative to that. ${workspaceFolder}, ${file} and other such variables are documented in VS Code’s Variables Reference.
Command Line Arguments
Let’s modify our Python program as follows:
import time
import datetime
import sys

while True:
    time.sleep(int(sys.argv[2]))
    print(f"{sys.argv[1]} church bells say it's {datetime.datetime.now()}")
The program now takes the nationality of the church bells as well as the sleep interval from command-line arguments. We’re not doing validation or error-handling for the sake of brevity. The following is an example of how to execute this successfully from a terminal:
$ python3 main.py Maltese 5
Maltese church bells say it's 2023-02-15 19:04:28.311805
Maltese church bells say it's 2023-02-15 19:04:33.315787
Maltese church bells say it's 2023-02-15 19:04:38.319811
To pass the same command-line arguments when debugging with VS Code, we add args to the launch configuration:
As you no doubt noticed, launch.json contains a JSON array of configurations. That means it’s very easy to add more of these configurations, for instance, when you need to provide different inputs:
From the Debug tab, you can then select the configuration you want to run from the drop-down before hitting F5 to debug with that configuration:
The drop-down in the Debug tab lets you select which Launch Configuration you want to debug.
A Launch Configuration for Node.js
Let’s add a new folder as a sibling to our Python folder, and add the following code in a new app.js file, completely disregarding cleanup for the sake of brevity and YOLO:
It works, writing output every second both to standard output and a file:
The Node.js program’s output can be seen in the Debug Console as well as the output file. The overall folder structure is also shown on the left.
The only problem is that the file was created top-level, and since we only specified a filename in the code (not a folder or path), then this must mean that Node.js is running with the top-level folder in VS Code as the current working directory. We can change that in the launch configuration using cwd:
When we run this again, the file is created under the jsticker folder.
Pre-Launch Tasks
Sometimes you want to run something before starting your program. For instance, in my work setup, I generate Swagger docs and perform other prerequisite tasks. But since we’re not doing anything that fancy, we’ll just delete the ding-dong.txt file every time we run the “Node.js Ticker” launch configuration.
To do this, we first need to add a tasks.json file inside the .vscode folder, next to launch.json, and add the following to it:
This defines a task called rmfile that will run rm ding-dong.txt from the jsticker folder. We then refer to this task in the relevant launch configuration using preLaunchTask:
And we can have lots of fun running and debugging it, as a reminder that Swiss church bells need to tell you the time all the time. It’s not like they sell watches in Switzerland or anything.
Our Go program runs via the “Go Ticker” launch configuration.
Environment Variables
As we’ve seen with the Python example, however, other countries also have church bells. Instead of using command-line arguments to customise the output, we’ll instead pass environment variables. First, we need to modify the code a little:
When you run it again, it makes all the difference:
The Go program runs with environment variables set.
Go Build Flags
Go has some specific build flags that can’t be passed as regular command-line parameters, such as build tags or the Data Race Detector. If you want to use these, you’ll have to pass them via buildFlags instead:
...
            "buildFlags": "-race",
...
Running Multiple Programs with Compounds
It’s common to need to run multiple programs at once, especially in a microservices architecture, or if there are separate backend and frontend applications. This can be done in VS Code using compound launch configurations. For instance, if we wanted to run both the Python and Go programs, we could define a compound as follows (compounds go after configurations in launch.json):
The compound simply refers to the individual launch configurations by name, and has a name of its own. It can then be selected from the drop-down in the Debug tab just like any other launch configuration. By running a compound, you can debug and hit breakpoints in any application that is part of that compound.
In fact, you’ll notice there is a new drop-down next to the debugging buttons towards the central-top part of the screen. This allows you to switch certain views (e.g. the Debug Console) between running applications.
A compound can be selected from the list of launch configurations in the Debug tab. When it is run, a dropdown appears next to the debugging buttons in the top part of the screen.
Conclusion
We’ve seen that Launch Configurations allow you to run and debug applications in VS Code with great flexibility, including:
Run the current file or a specific one
Set the current working directory
Run different programs
Use different programming languages
Set up different configurations even for the same program
Pass command-line arguments
Set environment variables
Run/debug multiple programs at the same time
This provides a great IDE experience even for more complex application architectures in a monorepo.
Project management, at its heart, involves planning the various tasks involved in a project and monitoring their gradual execution. The tasks are often organised in simple ways using task lists, Kanban boards, calendars, or Gantt charts, and prioritised based on importance. However, these methods often leave out something very fundamental: dependencies between tasks. What use is prioritisation, when task F cannot even commence before tasks D and E are ready?
This difficulty arises because relationships between tasks aren’t linear, and yet we use linear visualisations to make sense of them. By representing a project’s tasks as a graph instead, we can not only easily see the various dependencies, but also use critical path analysis techniques to gather more information about scheduling and risk.
This topic has been previously covered in the Project Management Neo4j graph gist by Nicole White. While it provides splendid coverage of critical path analysis with Neo4j, the article is unfortunately in poor shape, with its images, videos and formatting broken (although I’ve been able to locate an archived version of its graph image). It also represents tasks/activities as nodes, whereas I will be taking a different approach (representing tasks/activities as edges) which I originally learned back in my University days and feel is more intuitive.
Understanding Critical Path Analysis
To understand what we’re talking about, we first need an example.
The original graph.
The above diagram shows a relatively simple graph. Node A represents the starting point, whereas all the others represent different milestones that we need to deliver, including F which represents the final delivery and the end of the project. The arrows between nodes represent the tasks that need to be carried out in order to achieve the milestone where the arrow ends. Each arrow has a number which we can assume is the number of days we think the task will take (duration). In some cases the arrows diverge (e.g. B must be completed in order for either D or E to start) or converge (D and E must both be completed before F can start).
The graph with earliest start times.
At this point, we can calculate the earliest start time of each node. To understand this, let’s consider node E. In order for node E to start, the arrows leading up to it must both be completed. These include the paths ABE (duration = 2 + 4 = 6) and ACE (duration = 3 + 2 = 5). Since both must be completed, there’s no starting E before the longest of these (duration 6) has completed, so E’s earliest start time is 6. This is useful because, considering the tasks that occur sequentially or in parallel, it allows us to schedule a task at the appropriate time when its dependencies have been completed.
In order to calculate the earliest start time of all nodes, we do a forward pass from left to right, assuming that the earliest start time for node A is zero, adding up the durations leading to each node, and taking the highest number where multiple arrows converge to the same node. So:
A: assume earliest start time is zero.
B: 0 + 2 = 2.
C: 0 + 3 = 2.
D: 2 + 1 = 3.
E: max(3 + 2, 2 + 4) = 6.
F: max(3 + 6, 6 + 5) = 11.
The results are shown in the above diagram, where earliest start times are shown under the bottom-left portion of each node.
The graph with latest start times.
Next, we can calculate the latest start times, which tell us the latest day on which we can start each task without delaying the whole project. To do this, we start from the last node, setting its latest start time to the same value as its earliest start time (11 in the case of F). Then, we work backwards, subtracting the duration from the latest start time, and this time taking the minimum where a node diverges. So:
F: assume latest start time is same as earliest start time, i.e. 11.
E: 11 – 5 = 6.
D: 11 – 6 = 5.
C: 6 – 2 = 4.
B: min(5 – 1, 6 – 4) = 2
A: min(4 – 3, 2 – 2) = 0
The critical path consists of the nodes whose start and end times are equal – in this case this would be the path ABEF. If any of the tasks along this path are delayed, this would delay the whole project. On the other hand, nodes with different earliest and latest start times have some leeway. If the task along BD takes 3 days instead of 1 day, the path ABDF takes 2 + 3 + 6 = 11 days, which is the same as we need to get to F from the longer path, and so this doesn’t affect the overall project. The amount of leeway for each node is the difference between its latest and earliest start times. Nodes on the critical path have a zero difference and therefore get no leeway.
Running Neo4j with Docker
Now that we’ve seen how critical path analysis works with manual calculations, we’ll see how to create and analyse the same graph using a graph database, specifically Neo4j.
The easiest way to run Neo4j quickly is using Docker. Assuming we’re using Linux, Docker is already installed, and we want to destroy the container once it’s stopped, the following command achieves this purpose:
sudo docker run --rm -it -p 7687:7687 -p 7474:7474 neo4j
Once Neo4j is running, we can access the Neo4j Browser in a web browser via the URL http://localhost:7474/browser/. The default credentials to login are neo4j for both username and password, and these will have to be changed the first time. After that, the Neo4j Browser can be used to run Cypher queries and view their results.
Creating the Graph
To create the graph, we’ll run the following Cypher in the Neo4j Browser. The first set of statements creates the nodes. The second set locates the nodes we just created, and establishes the relationships between them. Since the statements end with a semicolon, they may be run all together in one go.
Once this is done, the resulting graph can be visualised by running the following simple Cypher query, which returns all nodes:
match(n)
return n
After adjusting the position of the nodes, as well as their colour and caption, the graph matches what we saw earlier:
The graph in Neo4j, as seen in the Neo4j Browser.
Setting Earliest Start Times
As we saw earlier, the earliest start times of each node are calculated by adding up the durations of each arrow leading to that node, taking the highest number in case there is more than one. In Neo4j, we can achieve this with a path query. We’ll build this step by step to clarify what the final query does.
We’ll start with this very simple Cypher query:
match path = (a:Milestone)-[:precedes*]->(b:Milestone)
return a, relationships(path), b
This gets every path between every two nodes, and returns the pair of nodes along with all the relationships along the way. The Text view of the result in the Neo4j browser is the following:
In our case, we just want the value of the durations along each path, so we extract the duration as follows:
match path = (a:Milestone)-[:precedes*]->(b:Milestone)
return a, [r in relationships(path) | r.duration], b
The part in square brackets on the second line simply means “for each relationship in the path’s relationships, take the duration”. The following is the simplified result:
This gives us a list of durations along each path. We can use the reduce() function to add them up, transforming the query as follows:
match path = (a:Milestone)-[:precedes*]->(b:Milestone)
return a, reduce(x = 0, r in relationships(path) | x + r.duration), b
reduce() uses x as an accumulator variable, adding the duration of each relationship to it and returning the final result. The result is now the following:
Finally, by using the max() function, dropping a from the result, and using a little ordering for clarity, we get exactly the earliest start times we wanted, using the following query:
match path = (:Milestone)-[:precedes*]->(b:Milestone)
return max(reduce(x = 0, r in relationships(path) | x + r.duration)), b
order by b.name
The resulting values, shown below, match what we calculated manually earlier:
╒═══════════════════════════════════════════════════════════════╤════════════╕
│"max(reduce(x = 0, r in relationships(path) | x + r.duration))"│"b"         │
╞═══════════════════════════════════════════════════════════════╪════════════╡
│2                                                              │{"name":"B"}│
├───────────────────────────────────────────────────────────────┼────────────┤
│3                                                              │{"name":"C"}│
├───────────────────────────────────────────────────────────────┼────────────┤
│3                                                              │{"name":"D"}│
├───────────────────────────────────────────────────────────────┼────────────┤
│6                                                              │{"name":"E"}│
├───────────────────────────────────────────────────────────────┼────────────┤
│11                                                             │{"name":"F"}│
└───────────────────────────────────────────────────────────────┴────────────┘
All we have left to do now is modify the query to set these values on each node:
match path = (:Milestone)-[:precedes*]->(b:Milestone)
with b, max(reduce(x = 0, r in relationships(path) | x + r.duration)) as earliest_start
set b.earliest_start = earliest_start
It is then trivial to verify that the nodes have been updated with the correct earliest start times:
A simple query shows that the nodes have been updated with earliest start times.
Setting Latest Start Times
Setting the latest start times is easier and does not require complex path queries. As we did manually, we work our way backwards, subtracting the duration from the earliest start time, and taking the minimum where there are multiple arrows emerging from a node. The following query does the trick:
match (a:Milestone)-[r:precedes]->(b:Milestone)
return a, min(b.earliest_start - r.duration) as latest_start
order by a.name
The following output shows values that match what we originally calculated manually:
We can set the latest start time on each node by adjusting the query slightly as follows:
match (a:Milestone)-[r:precedes]->(b:Milestone)
with a, min(b.earliest_start - r.duration) as latest_start
set a.latest_start = latest_start
Once again, we verify that everything has updated correctly:
A simple query shows that the nodes have been updated with latest start times.
Calculating the Critical Path: Maximum Duration
One way to calculate the critical path is shown in the aforelinked Project Management Neo4j graph gist by Nicole White. Adapted to our graph representation, the query for this is as follows:
match path = (a:Milestone)-[:precedes*]->(b:Milestone)
where a.name = 'A' and b.name = 'F'
with path, reduce(total_duration = 0, r in relationships(path) | total_duration + r.duration) AS total_duration
order by total_duration desc
limit 1
return nodes(path)
This method does not need earliest and latest start times at all. It works as follows:
It obtains all paths between the start and finish node (as per the where clause).
The total duration of each path is calculated with reduce().
The longest path is taken thanks to the order by … desc and limit 1.
As you can see from the screenshot below, this method works pretty well.
The critical path shown in Neo4j Browser.
Calculating the Critical Path: Equal Start Times
You might remember from earlier that the earliest and latest start times are equal in each node along the critical path, so this gives us another way to calculate the critical path. To do this, though, we first need to update the start and end nodes to fill in their missing earliest and latest start times, as follows:
match(a:Milestone)
where a.name = 'A'
set a.earliest_start = 0;

match(f:Milestone)
where f.name = 'F'
set f.latest_start = f.earliest_start;
We can then obtain the critical path as follows, using the all() predicate function to ensure that we pick only the nodes having equal earliest and latest start times:
match path = (a:Milestone)-[r:precedes*]->(b:Milestone)
where a.name = 'A' and b.name = 'F'
and all(node in nodes(path) where node.earliest_start = node.latest_start)
return nodes(path)
As you can see, this method works just as well:
The critical path shown in Neo4j Browser.
Conclusion
Although we’re feeling so Agile nowadays with all these fancy Kanban boards, the nature of projects, tasks and their dependencies makes them best represented by graphs. Additionally, using critical path analysis, it’s possible to obtain useful analytics, such as the optimal time to schedule tasks, which tasks risk delaying the whole project, and which tasks may be delayed without impacting the project delivery.
This scenario served as an example to explore relatively advanced Cypher features, including path queries and various functions.
"You don't learn to walk by following rules. You learn by doing, and by falling over." — Richard Branson


